Our world is surrounded by many stationary objects, though at some point in time, those objects were moved there, or had to come from somewhere else. We rely on this phenomenon as teachers when students magically appear for class at the beginning of each lesson only to sit still and refrain from all forms of external movement as they close their eyes…
What if we instead tried to test the students and observe them moving from Point A to Point B? Some students might be quicker, others slower and others so slow that they miss class. So…
How can we measure the motion of an object/student?
(Take a few moments to discuss and record in class, think about examples and Units)
Practical: Measuring the Speed of Students
Aim: To measure how fast a student can get from Point A to B
(General suggested method below) In groups of 3-4:
- Measure a fixed distance 50-100m in the Year 10 area and record in Book (m)
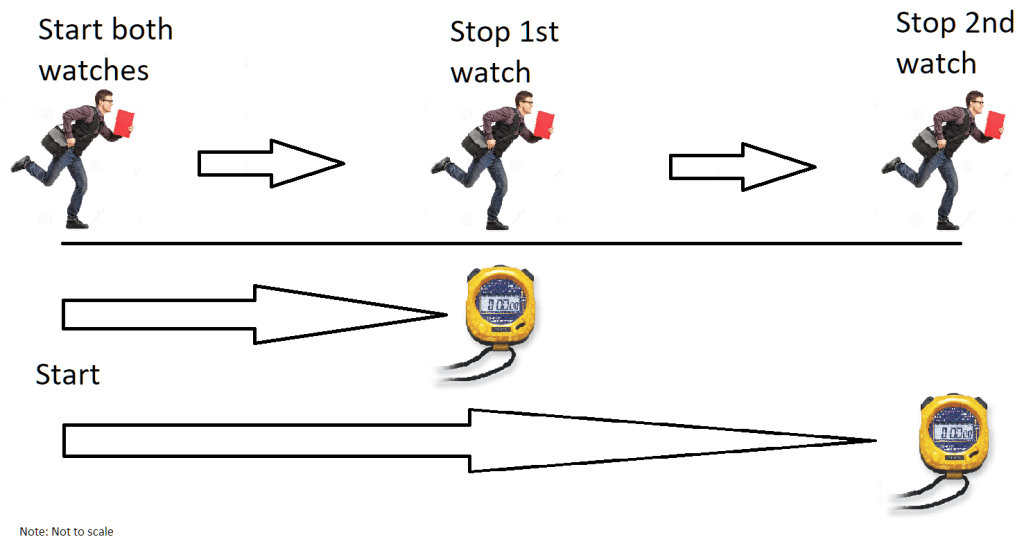
- Have someone with a stopwatch at the half way (50m mark) and at the end (100m).
- Use a stop watch to measure how long it takes a student to get from start, middle and finish. Record time in book (s). (NOTE: start both watches AT THE SAME TIME)
- Repeat this experiment at least 3-5 times OR until you get consistent results. Record as you go
- Calculate the average speed of the student in your book. (You should have 2 average speeds)
Results
| Trial | 50m Time (s) | 50m Speed (m/s) | 100m Time (s) | 100m Speed (m/s) |
| 1 | ||||
| 2 | ||||
| 3 | ||||
| 4 | ||||
| Avg |
Discussion
- Was the motion consistent? If so, why/why not?
- How did the 50m and 100m speeds compare?
- If the distance were to increase, would the difference be greater or smaller?
- How do your running times compare to Olympic Athletes or cars? Usain Bolt and Tesla Roadster
Conclusion
Come up with your own conclusion which can summarise why speed isn’t consistent over a distance.
Observing changes in speed
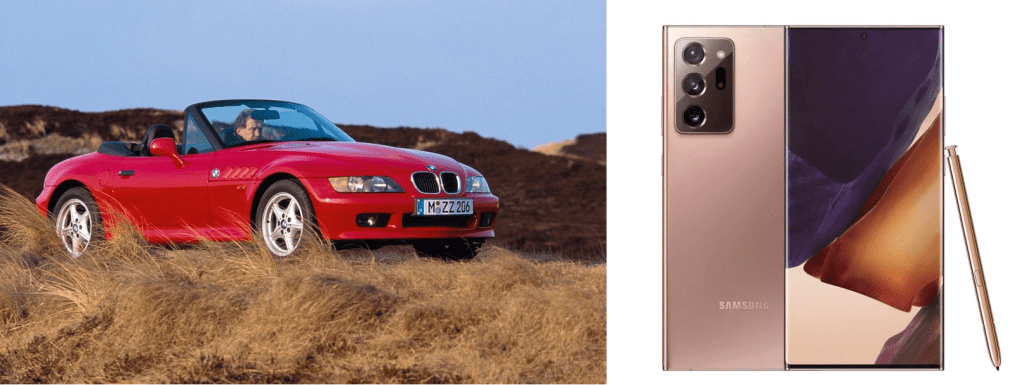
When it comes to cars and technology, people can get obsessed with speed. No one wants to be left waiting behind with the slowest car or last years smart phone.
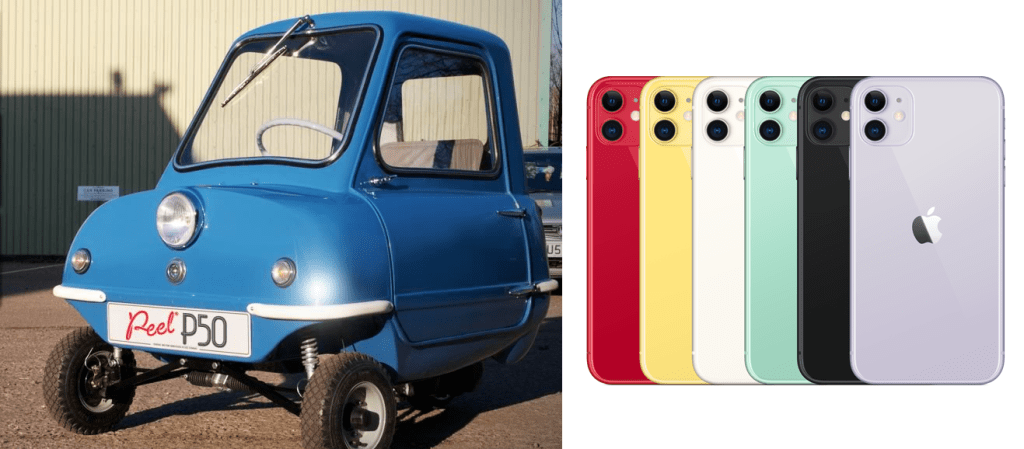
They want speed! Science and industry keeps pushing and pushing to make things faster and faster for consumers. This results in greater speed, but also a much higher price tag.
Or… you could try cheating? Which one do you think would win in a race? A car falling 1 Mile (~1.61km) or a car doing a 1 Mile drag race? Gravity pulls us down to Earth at 1G (One Gravity), though some cars like the Porsche in this video can exceed the acceleration of Gravity by doing ~1.1G
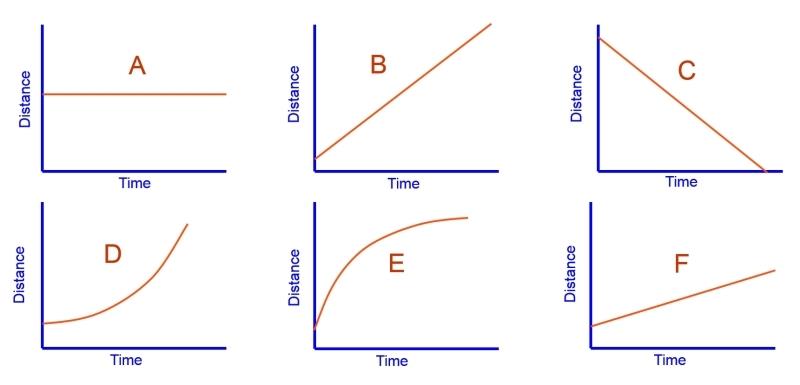
Examining changes in Speed
Below are a series of line graphs without units, draw them into your books and be sure to record the correct axis’s. Make a prediction in your book as to what speed the lines are indicating. Choose from the following options:
| Slowing to a stop | Stationary | Slowly moving |
| Increasing speed | Going backwards | Quickly moving |
Position, Velocity, Acceleration
Before we continue onto Newtons Laws of Motion, it’s good to learn a few of the extra terms that need to be covered in this Motion Topic. Practice to actively take notes during the video to use as a quick reference, as the terms will be used again throughout the topic
